You are not logged in. Click here
 to log in.

codebeamer Application Lifecycle Management (ALM)
Please contact sales@intland.com for more information about high availability clustering!
codeBeamer ALM's Official Scalability Performance Test Report 2019with up to 1,000 concurrent users, 10 million work items, and 35,000 requirements in a single documentTable of Contents
The purpose of this documentIn February 2019, we carried out a comprehensive performance testing session of codeBeamer ALM with 1,000 users, 10 million artifacts (work items), and 35,000 requirements in a single document (tracker). The purpose of this document is to give you an overview of both the process and the environment that we have used for testing the performance of our ALM platform in order to help you interpret and understand the results. These tests may be repeated with the same configuration any time, and can be reasonably expected to yield similar results. Testing showed that codeBeamer ALM worked swiftly and smoothly with 10 million work items (artifacts). If your environment requires the management of an even larger volume of work items, please contact us For this performance test we used a Fujitsu PRIMERGY TX2550 M4 Server with 12 CPUs x Intel(R) Xeon(R) Gold 6128 CPU and 128 GB RAM, running a Linux (CentOS 7) with an Oracle 12c database. These performance tests do not yet cover Windows-based installations or MySQL databases. Hardware ArchitectureTest serverThe server used for testing was a Fujitsu PRIMERGY TX2550 M4 Server with 2 CPUs x Intel(R) Xeon(R) Gold 6128 CPU and 128 GB RAM of total RAM. The same piece of hardware was used for all the performance tests. The approximate market price of the test server is around $10,000. VMware ESXi 6.7 was running on the server.
The tests ran on the same ESXi server. It is recommended to use two separate servers for codeBeamer and Oracle instances and at least 10 Gbit Network is required between these servers archiving the optimal performance on the Production environment. codeBeamer ALM instanceThe virtual server of this codeBeamer ALM instance ran with the following configuration:
Database instanceThe virtual server of this Oracle instance ran with the following configuration:
Test topology
Software components and versionsBoth codeBeamer ALM and Oracle virtual machines ran on CentOS 7. codeBeamer ALM was configured to run with OpenJDK version 8 and a maximum of 16 GB heap size (from max. available 32 GB memory).
codeBeamer ALM configurationTomcat server configurationThreadPool configuration To serve a higher load we increased Tomcat's thread pool count in server.xml: <Executor name="tomcatThreadPool" namePrefix="catalina-exec-" maxThreads="500" ></Executor> Database connection configurationTo match the volume of database connections we increased the maxActive to 150 and maxIdle to 50 in the database connection settings in my-applicationContext.xml<bean id="sharedPoolConfig" class="org.springframework.beans.factory.config.MapFactoryBean" abstract="true">
<property name="sourceMap">
<map>
<entry key="defaultAutoCommit" value="true"></entry>
<entry key="defaultReadOnly" value="false"></entry>
<entry key="defaultTransactionIsolation" value="READ_COMMITTED"></entry>
<entry key="maxActive" value="150"></entry>
<entry key="maxIdle" value="50"></entry>
<entry key="minIdle" value="5"></entry>
<entry key="initialSize" value="0"></entry>
<entry key="testOnBorrow" value="true"></entry>
<entry key="testOnReturn" value="false"></entry>
<entry key="testWhileIdle" value="false"></entry>
<entry key="minEvictableIdleTimeMillis" value="300000"></entry>
<entry key="timeBetweenEvictionRunsMillis" value="60000"></entry>
<entry key="removeAbandoned" value="false"></entry>
<entry key="removeAbandonedTimeout" value="300"></entry>
<entry key="logAbandoned" value="false"></entry>
</map>
</property>
</bean>NetworkFor network connections between the codeBeamer ALM server and the database, we recommend using a low latency time connection (less than 1 ms) and at least 10Gb network bandwidth.
During testing, all connections used HTTP ports. Testing toolsFor test planning and execution we used JMeter version 3.3 with Jenkins integration version 2.107.3 (for automatic execution only). Test data shape and volumeThe work items, users, projects, trackers, comments, reference (links), history and other elements were evenly distributed among the projects. The following table represents the number of work items by type. The table below shows that for 10 million work items (i.e. 10 million requirements), there were 30 million comments, and 203 million history entries in the database repository.
Test cases, scenariosWe used Apache JMeter to simulate the workload and to measure the performance of codeBeamer ALM. One test script was created for all three user actions. In the script, each HTTP request represented a user action. We started with 100/250/500/700/1000 concurrent users respectively, with all users logged in over a period of 15 minutes. Tests were then run for another 45 minutes. User actions during testing were simulated with a 1 minute thinking time for each user. The following table shows the use cases and the percentage of users running each use case:
Test performance results with up to 10 million work items and 1,000 concurrent usersStress test with 1,000 concurrent loginsWe used a database of 10 million work items (i.e. requirements, bugs, test cases) to measure the response time for login requests. The login stress test simulates 1,000 concurrent user logins in 300 seconds. See the response times below.
Average response timeThe following table summarizes the overall average response time for each user request using different user levels for the tested software / hardware configurations. Tests were carried out with 10 million work items (i.e. requirements, bugs, or test cases) and 100 - 1000 concurrent users.
Response Time DiagramThe diagram shows the average response time vs concurrent users and for repositories with 10 million (10M) Work Items (i.e. requirements). Detailed results of performance test runs10M Work Items - 1000 concurrent Users
Performance test with 35,000 requirements in a single documentMost requirements documents only have a few hundred or a few thousand requirements. In working with our customers, however, we often encounter over 30,000 requirements in a single document. The test scenario below shows our performance test for such documents. ReqIF file import performance with 35,463 requirementsWe use a ReqIF file (55 MB) with 35,463 requirements for the import performance test. The ReqIF file import takes 25 minutes.
Requirement Edit/View performance with 10,000 and 35,000 requirements in a single documentThis performance measurement shows you how much time it takes to open a requirements document (one document or one module) in codeBeamer's "Document View" mode using a web browser. In the two test scenarios, the requirements documents have 10,000 and 35,000 requirements respectively. As an example, a modern car's entertainment system software might have 35,000 requirements. Google Chrome 59.0.3071.86 browser was used in our test.
|

codebeamer Overview codebeamer Knowledge Base Services by Intland Software |
 for more performance data.


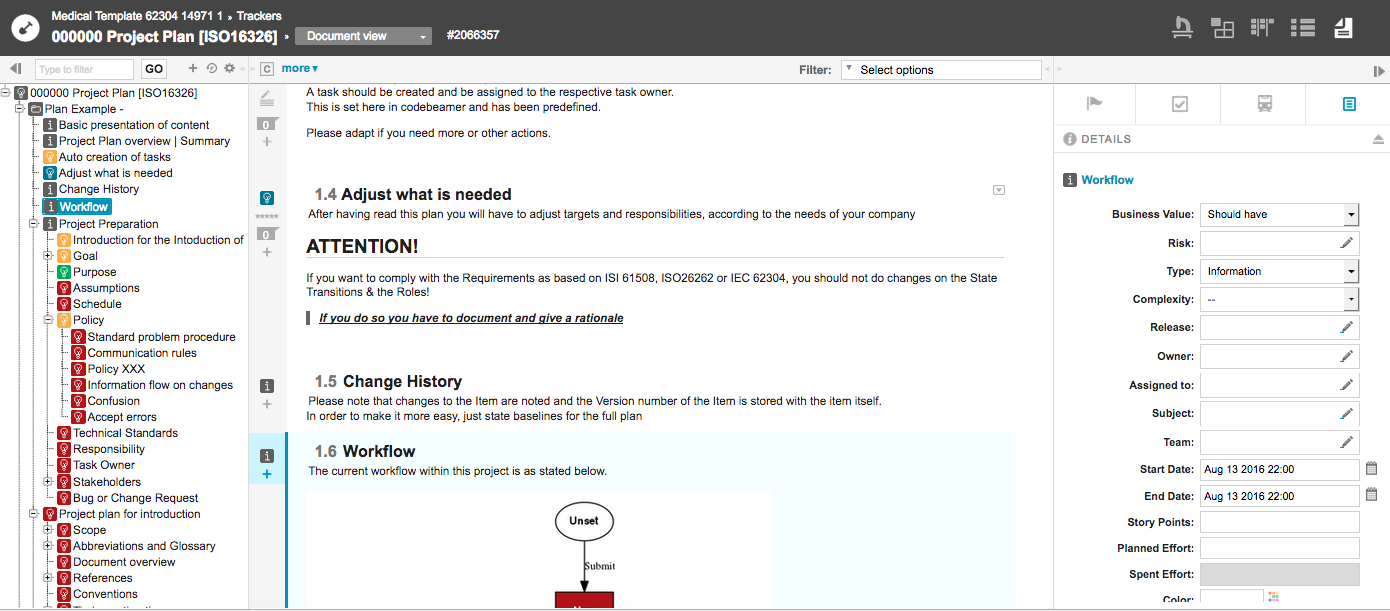 Figure: "Document View" mode in web browser
 Hotkeys