You are not logged in. Click here
 to log in.

codebeamer Application Lifecycle Management (ALM)
Release Gantt ChartRelease Dashboard already offers a wide variety of tools to monitor the progress of releases; Release Gantt Chart is the latest addition to this toolset. Just as its First stepsThe Release Gantt Chart is part of the Release Dashboard. At first a release must be selected on the Release Dashboard, which opens the release specific page. It can be revealed by clicking on the Release Gantt Chart text.
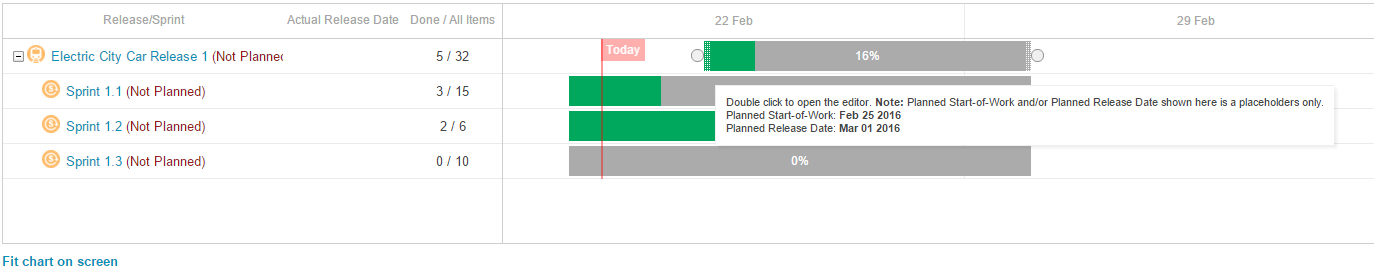
Basic viewReleases missing Planned Start-of-Work or Planned Release DateLet's start with an example release, which does not have any required date fields set. As the chart depends on these fields, it only renders the releases using placeholders. The Release Gantt Chart has the following sections:
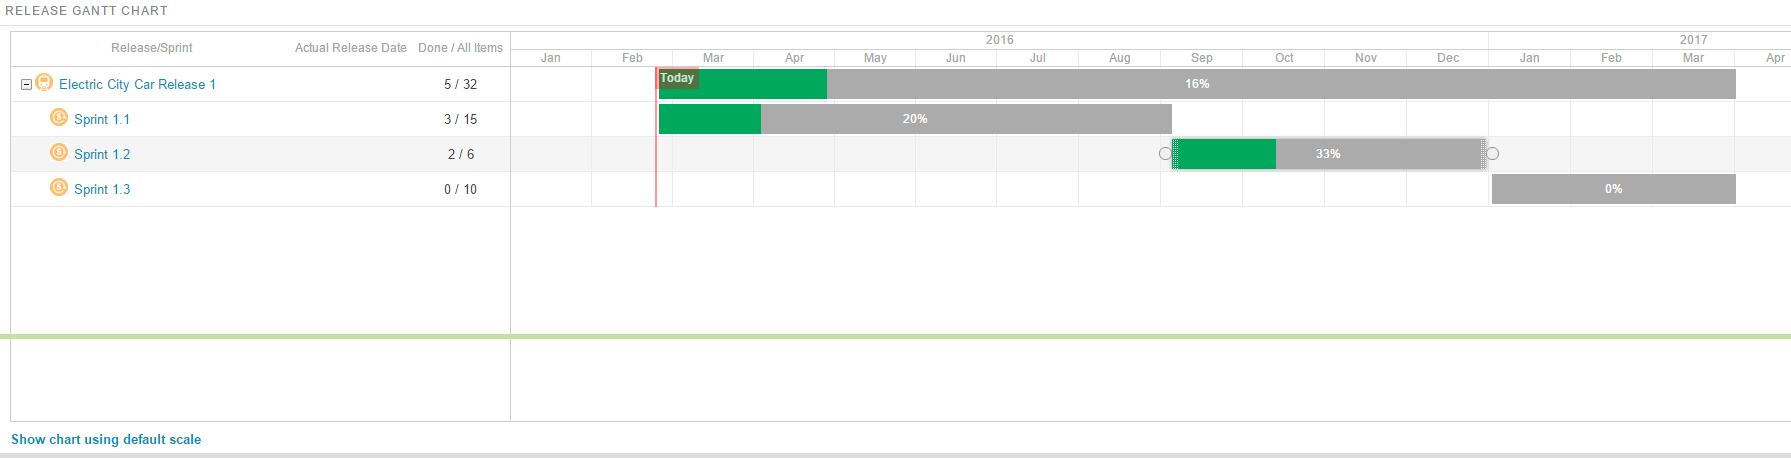
In this example none of the releases or sprints has the Planned Start-of-Work or Planned Release Date fields set. This is why the Information Bar lists all of them, and Not Planned text is shown next to their description. The chart displays all of them using the same placeholder schedule. And this is how the chart would like with properly scheduled release and sprints: Releases with Release Method fieldReleases in projects created with at least codeBeamer version 7.8.1 has an extra field called Release Method. The Release Gantt Chart renders the vertical bars with different pattern depending on the selected Release Method. It is possible to customize the field on the Release Tracker's configuration page: Altering releases on the Release Gantt ChartDrag&Drop operationsRelease Gantt Chart not only displays releases and included sprints, but also offers the possibility to easily modify the values of Planned Start-of-Work or Planned Release Date fields. One option to achieve that is moving the mouse cursor over the edge of a vertical bar. A couple of circle markers and a wide handle will appear. Grabbing that handle while holding the left mouse button down makes it possible to move the edge of the vertical bar. Moving one of the edges modify the Planned Start-of-Work or Planned Release Date field and affects the length of the release or sprint. Another possibility is moving the mouse cursor over the middle of the vertical bar, and grabbing the whole bar while holding the left mouse button down. This moves the vertical bar along the timeline. The length of the release or sprint does not change, but both the Planned Start-of-Work or Planned Release Date fields will be updated. Please note that the displayed tooltip always shows the actual dates during the drag operations! Pop-up editorRelease Gantt Chart also offers a pop-up editor with datepicker for simple and precise date selection. It can be opened by double clicking on a vertical bar. The value of the Release Method field can be modified as well. (Only in case of Release Trackers having Release Method field) PermissionsUsers with proper permissions can use the above-mentioned options for altering releases or sprints. A user must have Issue - Edit Any or Issue - Edit if Owner permission to be able to use these features, The permissions can be set by the project administrator on the Release Tracker configuration page. If a user does not have the permissions to modify releases or sprints, the chart still shows up, but a tooltip message reminds the user of this fact: Customizing Release Gantt ChartTime ScalesRelease Gantt Chart shows the releases using a timeline. The scale by default is one week; first day of the week is shown above each column to distinguish weeks. The chart displays releases longer than a couple of weeks with scrollbars and applies a fixed maximum length in some cases. This is where the Fit chart on screen action link can help; it renders the chart so that all releases fit into the visible area by applying a different time scale: Switching back to the default view can be achieved by clicking on Show chart using default scale action link. Resizing Release Gantt ChartRelease Gantt Chart has a default height, which might not be the optimal height in some cases. The chart itself adds scrollbars, when the displayed releases and sprints require more space than available for the chart. However there is a convenient option to control how much space the Release Gantt Chart takes up. Moving the mouse over the slightly wider bottom border and dragging it while holding the left mouse button down makes it possible to move the bottom border to a different position. After releasing the mouse the chart is refreshed and placed inside the newly defined area. The user-defined height of the component is also saved and applied whenever the user opens the Release Dashboard. |

codebeamer Overview codebeamer Knowledge Base Services by Intland Software |


 Hotkeys